 Aircraft Bluebook Marketline | Comments Off |
  Charts
  Thursday, May 31, 2007 at 11:00PM
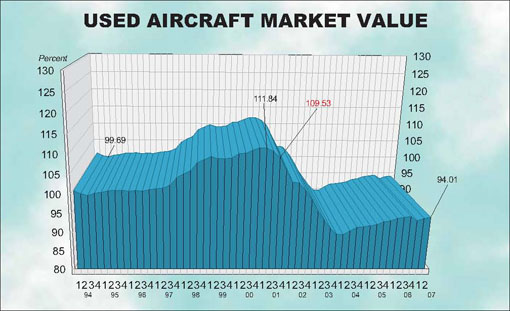
Used Aircraft Market: This chart displays each model's quarterly value in relationship to its average equipped price at the inception of the aircraft. The study begins in the spring quarter of 1994 and includes the Jet, Turboprop, Multi, Piston and Helicopter. For all charts, the red number indicates the first reporting date after 9-11.
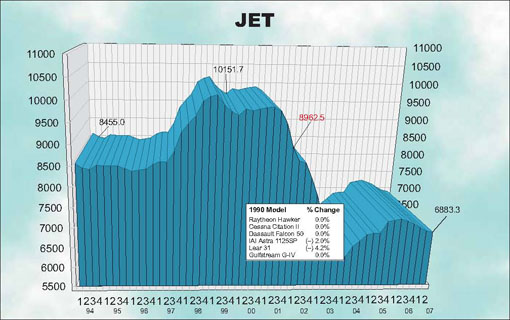
Jet: The jet chart depicts the average price (in thousands) of the six 1990s jets listed in the box.
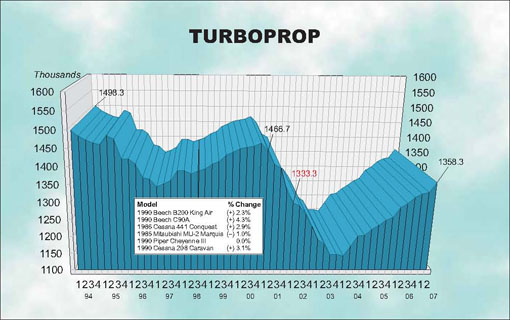
Turboprop: The turboprop chart depicts the average price (in thousands) of a 1985, 1986 and four 1990 turboprops listed in the box.
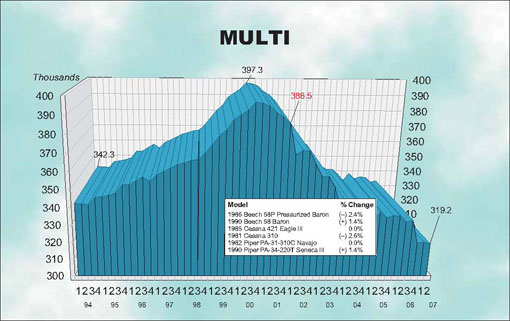
Multi: The multi chart depicts the average price (in thousands) of the six multi models listed in the box. Each model’s year will precede the name of the aircraft.
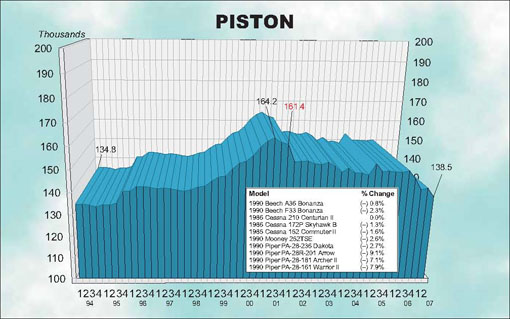
Piston: The piston chart depicts the average price (in thousands) of the 10 pistons listed in the box. Each model’s year will precede the name of the aircraft.
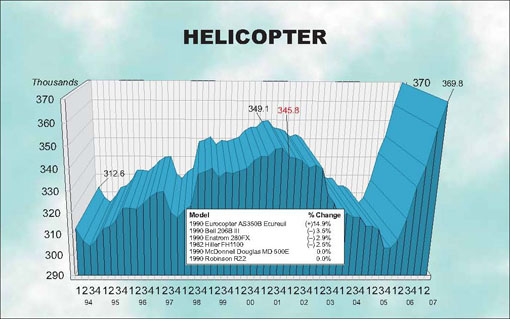
Helicopter: The helicopter chart depicts the average price (in thousands) of the six helicopters listed in the box. Each model’s year will precede the name of the aircraft.
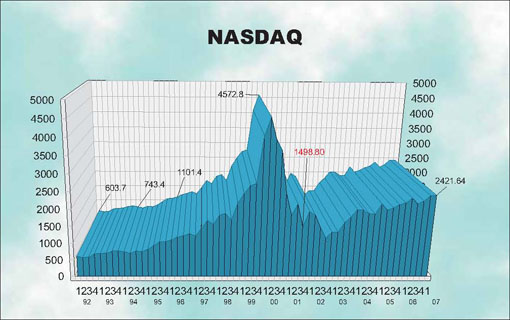
NASDAQ: This ratio scale chart depicts the change for the NASDAQ daily average from quarter to quarter beginning at the end of the first quarter of 1992. Each data point represents the closing daily average on the last trading day of each quarter. This study originates in the first quarter of 1971.
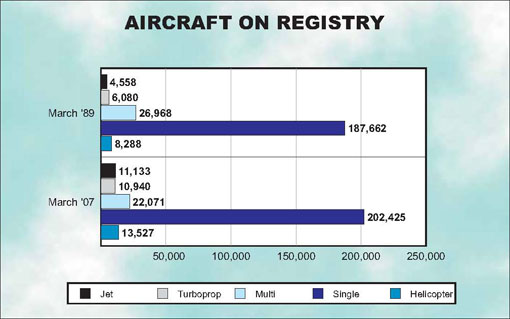
Aircraft on Registry: The Aircraft on Registry chart depicts the number of aircraft reported in Aircraft Bluebook that are listed on FAA records and considered to be in the U.S. inventory.
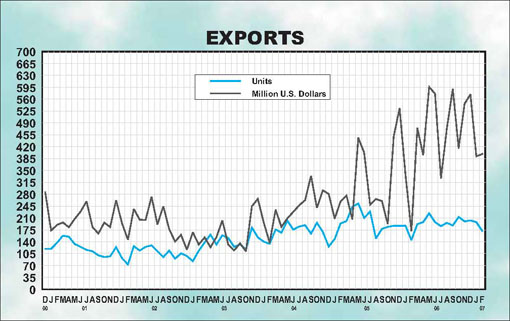
Export Data: These numbers include both airplanes and helicopters. The numbers do not include aircraft that have empty weights in excess of 33,069 lbs.
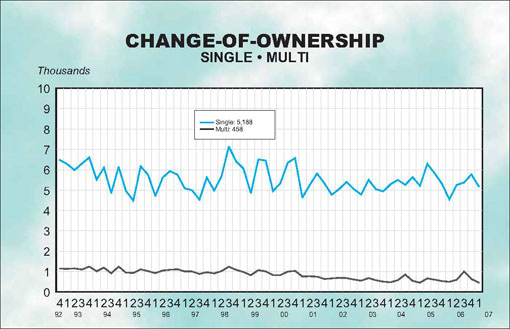
Single/Multi: The blue line in the Single/Multi chart depicts change-of-ownership data for singles. The black line represents multis.
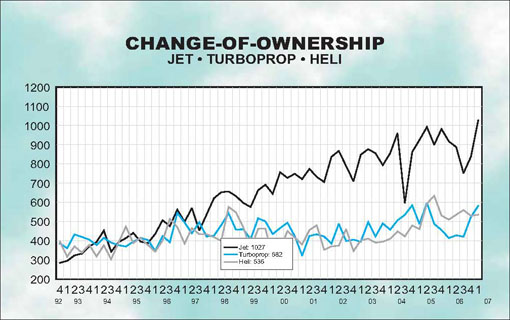
Jet/Turboprop/Heli: The black line in the Jet/Turboprop/Heli chart represents change-of-ownership information for jets. The blue line depicts turboprops, and the gray line represents helicopters.
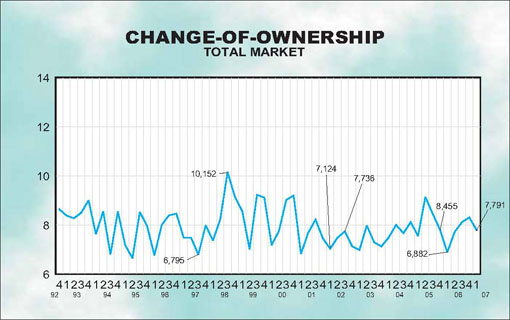
Total Market: Depicts change-of-ownership data for all aircraft included in the Aircraft Bluebook. The numbers are from the FAA Registry. Gliders, homebuilts, airliners and other aircraft not found in the Bluebook are not included in this study.
 Aircraft Bluebook Marketline | Comments Off |
  Charts
  Thursday, March 1, 2007 at 4:16PM
 by Paul Wyatt, Managing Editor | Aircraft Bluebook – Price Digest
We’ve often commented that the used aircraft market is a direct reflection of two major influences: the U.S. economy and the production levels of the new aircraft manufacturers.
Both of these entities are heading into record territory in 2007.
Recently released sales figures from the General Aviation Manufacturers Association showed that 2006 was a spectacular year for new aircraft sales. Total sales reached $18.8 billion dollars (up 24.1 percent) on 4,042 deliveries (up 12.9 percent). The huge backlogs at the OEMs have resulted in many impatient buyers locating late-model planes to meet their immediate needs.
Demand for these new and used planes is directly tied to the ebb and flow of the stock market and corresponding corporate profits. Inflation has slowed, the housing slump has hopefully bottomed out, and economic growth is strong. In short, things are on track for another record-breaking year in general aviation.
But the news isn’t rosy for dealers with older inventory. Again, whether it’s a jet or a piston single, everyone is clamoring for late-model planes. New paint and a re-rag on a plane built twenty-five years ago is still a difficult sale.
However, new products are popping up such as the Alliant glass cockpit retrofit for older King Air 200s. Combined with the upcoming Garmin G1000 package for King Air C90s and the G600, which will be marketed to the entire piston retrofit market, these companies and others are working to keep these older planes viable in the used market.
Bluebook-at-a-glance
Increased — 118
Decreased — 54
Stable — 582
A record 2097 used business jets traded hands in 2006. That figure is almost twice the number sold in all of 2001. Jet dealers are bullish on 2007, and early sales reports to the Bluebook reflect that optimism.
In the smaller jet market, the Beech 400As are active, but prices again were unchanged. “The Beechjet is an exceptional value,” commented one dealer. “It runs around a million less than the Citation Vs of the same age with the same engines. I can make that sale every time.”
The Cessna 525 series continues to firm up with earlier Citationjets steady and a slight increase for 2000 and 2001 CJ1s (up $50,000). Late-model CJ3s are very hard to find, and prices were up $200,000. Citation Bravos were up as much as $100,000 and the Encores were up an impressive $200,000.
Other small jets such as the Falcon 100 and the Lear 35 remained firm.
Most medium-sized jets were unchanged from the previous Bluebook. The Cessna 650 series (VIs and VIIs) has seen little price fluctuation during the last two quarters, but the Citation III was down $100,000. The late-model Citation XLS is still very hard to come by, and late models were up $300,000. Hawker 800s and the Lear 55/60s are steady.
Several large long-range jets made the biggest moves of all with several Falcon 900EX up as much as $1.2 million. Most earlier model 900s were up half a million. Late model Falcon 2000EXs were up $2 million as well.
The late model Global Express was up an astounding $4 million. This was the largest single one-quarter adjustment in the history of the Bluebook. The Gulfstream G-550 was close behind with a $3 million bump.
However, older Falcon 50s were not at the party, and values fell $200,000.
Bluebook-at-a-glance
Increased — 121
Decreased — 11
Stable — 165
Traditionally, the fourth quarter has been prime time for turboprop sales and 2006 was no different. There were 406 sales in October, November and December. This market shows no sign of cooling, and many dealers report 2007 has started with very intense activity.
Beech King Air 350s continue to rise and were again up an additional $100,000 for the entire production run. In turn, the King Air 300s are sharing that popularity and were also up $100,000. The 200/B200 King Air market continues to be extremely active with much activity, but prices are currently steady.
The hot-rod F90 King Air is regaining ground and was up $100,000 for late models. The E90s were up slightly by $25,000 and C90As and Bs received the same slight adjustment.
The Pilatus PC-12 continues to shine, and late models were up as much as $200,000. Cessna Caravans were up $25,000 for recent year-models.
The Piaggio P180 is grabbing attention, and prices were up $200,000.
The Cessna Conquest Is and IIs, as well as the Piper Cheyenne Is, IIs, and IIIs were all unchanged.
Bluebook-at-a-glance
Increased — 39
Decreased — 20
Stable — 601
For the most part, prices have stabilized in the piston twin market. It’s too early to proclaim that the freefall is over, but later model planes are selling, and in some instances, they are even bringing decent money.
One dealer commented, “I sound like a broken record, but the light twin market is still very soft. But after the first of the year, I’ve really seen an increase in response to my ads.”
To convert those phone calls into completed sales is still difficult in this market. The plane had better be a pristine late-model specimen to close the deal. Late model 58 Barons are good candidates to be in this condition and received an increase of $5,000 for early 90s models.
Pressurized Barons were up $10,000 for several year-models. Cessna 310s are getting looks again and were up slightly (plus $3,000).
The spar AD still looms over the Cessna 400 series, and the newest models of both the 414A and the 421C were off $10,000.
Piper twins both large and small, old and new remained steady.
Bluebook-at-a-glance
Increased — 77
Decreased — 49
Stable — 2234
It’s been a cold and lonely winter so far for the single piston market. One dealer commented, “Even the bargain hunters are lying low and waiting for the thaw.”
However, some singles are selling. The late-model Cessna, Cirrus and Columbia shoppers are out there and are not letting the weather freeze their desire for the latest in glass cockpit technology. Though not climbing, prices for these planes have remained strong.
The older complex singles still go wanting for buyers, and unless they’ve undergone a transformation similar to AOPA’s “better than new” restoration, sellers are going to have to slash prices. Prices for these planes took a hit in our previous book, but this time most have remained flat. Buyers always emerge when the prices fall, but how low these planes will have to be priced will be revealed as we move into spring and summer.
Among the singles falling in value were the late-model Cessna 206s (down $5,000).
Bonanzas built in the 80s and early 90s bucked the trend and experienced a small amount of appreciation. The A36 gained $3,000 and the F33 moved up $5,000.
Bluebook-at-a-glance
Increased — 123
Decreased — 10
Stable — 756
The used helicopter market is still on the rebound, and sales numbers have been healthy in both turbine and piston segments. However, a stabilization of petroleum prices will temper the recovery in 2007.
Traditionally, the turbine helicopter market (both new and used) hinges on the ability of government agencies to improve and update their equipment. When larger police and EMS departments opt for new ships, smaller cities and towns are able to purchase the trade-ins. The robust economy has resulted in fuller tax coffers that make these purchases possible.
The models that experienced increases included the Eurocopter AS 350B series which experienced a $100,000 jump (up 20 percent). Other ships on the move include the EC 135P1 and T1 (up $25,000), the Agusta A109C (up a strong $50,000), the Bell 412 and 412SP (up $50,000) and the Bell 430 (up an impressive $1 million for several year-models).
Several iterations of the Sikorsky S-76 received upward adjustments of $500,000.
Late-model Robinson R22s are trading briskly and experienced a modest bump of $5,000 to $8,000.
 Aircraft Bluebook Marketline | Comments Off |
  Newsletter
  Wednesday, February 28, 2007 at 11:00PM
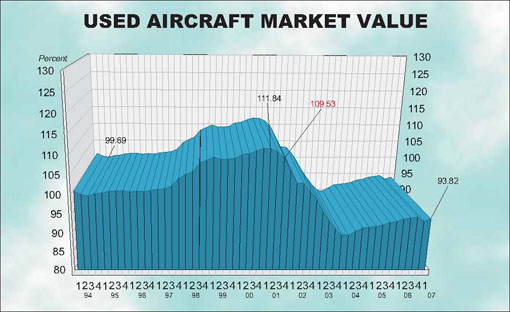
Used Aircraft Market: This chart displays each model's quarterly value in relationship to its average equipped price at the inception of the aircraft. The study begins in the spring quarter of 1994 and includes the Jet, Turboprop, Multi, Piston and Helicopter. For all charts, the red number indicates the first reporting date after 9-11.
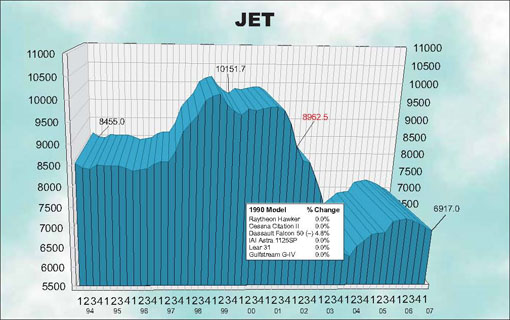
Jet: The jet chart depicts the average price (in thousands) of the six 1990s jets listed in the box.
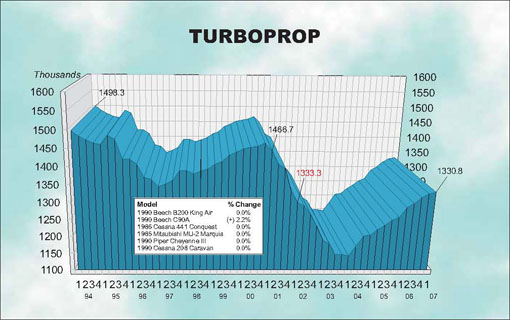
Turboprop: The turboprop chart depicts the average price (in thousands) of a 1985, 1986 and four 1990 turboprops listed in the box.
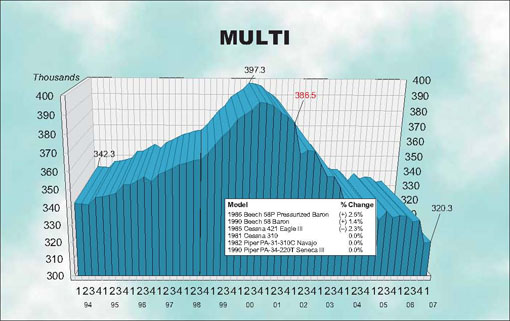
Multi: The multi chart depicts the average price (in thousands) of the six multi models listed in the box. Each model’s year will precede the name of the aircraft.
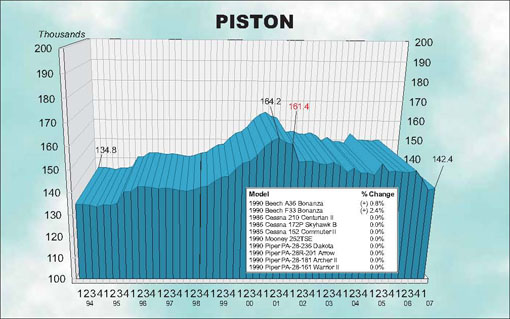
Piston: The piston chart depicts the average price (in thousands) of the 10 pistons listed in the box. Each model’s year will precede the name of the aircraft.
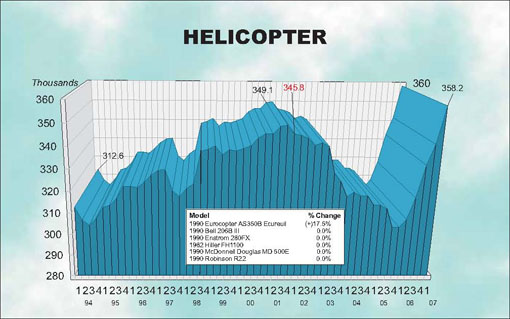
Helicopter: The helicopter chart depicts the average price (in thousands) of the six helicopters listed in the box. Each model’s year will precede the name of the aircraft.
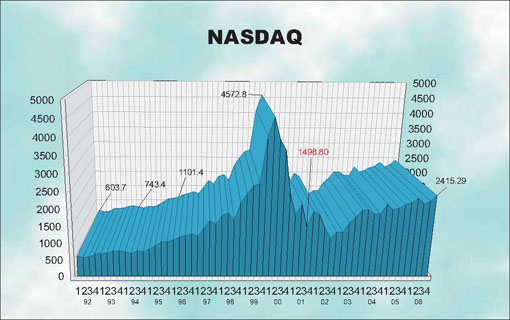
NASDAQ: This ratio scale chart depicts the change for the NASDAQ daily average from quarter to quarter beginning at the end of the first quarter of 1992. Each data point represents the closing daily average on the last trading day of each quarter. This study originates in the first quarter of 1971.
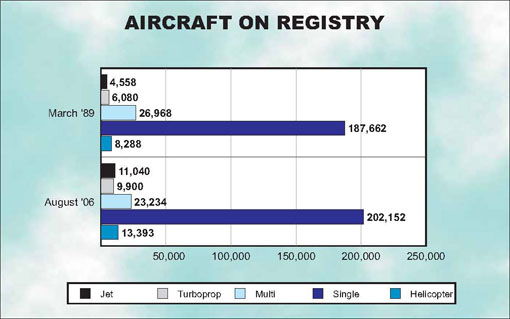
Aircraft on Registry: The Aircraft on Registry chart depicts the number of aircraft reported in Aircraft Bluebook that are listed on FAA records and considered to be in the U.S. inventory.
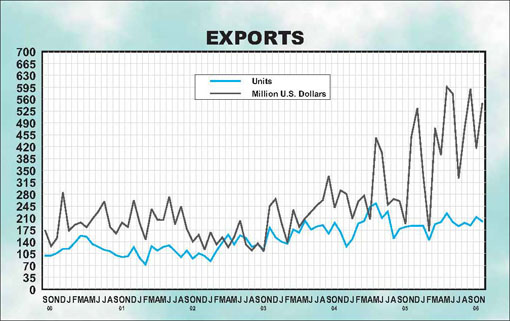
Export Data: These numbers include both airplanes and helicopters. The numbers do not include aircraft that have empty weights in excess of 33,069 lbs.
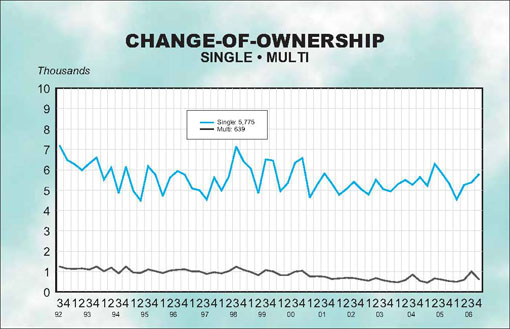
Single/Multi: The blue line in the Single/Multi chart depicts change-of-ownership data for singles. The black line represents multis.
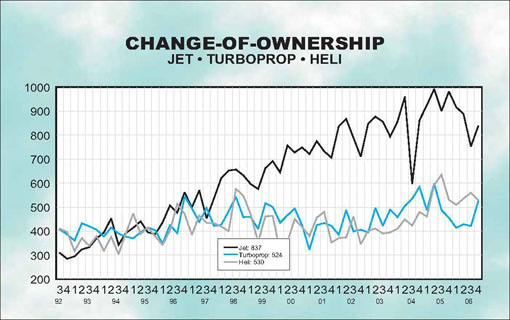
Jet/Turboprop/Heli: The black line in the Jet/Turboprop/Heli chart represents change-of-ownership information for jets. The blue line depicts turboprops, and the gray line represents helicopters.
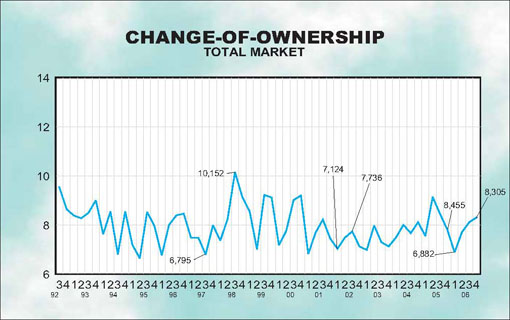
Total Market: Depicts change-of-ownership data for all aircraft included in the Aircraft Bluebook. The numbers are from the FAA Registry. Gliders, homebuilts, airliners and other aircraft not found in the Bluebook are not included in this study.
 Aircraft Bluebook Marketline | Comments Off |
  Charts