 Aircraft Bluebook Marketline | Comments Off |
 Entries in nasdaq (3)
Aircraft Values and Indicators
 Thursday, February 28, 2019 at 3:08PM
 Medium Jet
The Medium Jet chart depicts the average price (in thousands) of the six jets listed. Each model’s year will precede the name of the aircraft.

Download the full winter 2018 issue of Aircraft Bluebook Marketline to read more.
Aircraft Values and Indicators
 Thursday, December 6, 2018 at 3:38PM
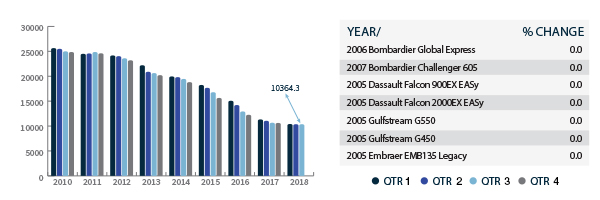
 Large Jet
The Large Jet chart depicts the average price (in thousands) of the seven jets listed. Each model’s year will precede the name of the aircraft.
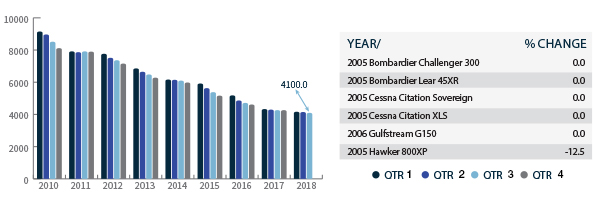
Medium Jet
The Medium Jet chart depicts the average price (in thousands) of the six jets listed. Each model’s year will precede the name of the aircraft.
Download the full fall 2018 issue of Aircraft Bluebook Marketline to read more.
Subscribe to the Aircraft Bluebook Marketline newsletter.
Situational Awareness
 Thursday, December 6, 2018 at 2:33PM
General Dynamics Buys Nordam Nacelle Line for Gulfstreams
Gulfstream maker General Dynamics (GD) said Oct. 1 it acquired the Nordam Group’s nacelle manufacturing line for the Gulfstream G500 and Gulfstream G600, ending a drama that saw the latter file for bankruptcy and threats arise to one of industry’s high-profile business jets.
GD said it will continue to operate the line at Nordam’s Tulsa, Oklahoma, facility. A federal bankruptcy judge approved the transfer Sept. 26, clearing the way for the acquisition. Terms will not be disclosed, the company added.
According to GD, a deal for the line was filed in court in September. What is more, GD had been operating the line “since early September” under a sublease as parties worked to address Nordam’s bankruptcy, filed July 22.
“Gulfstream has a 60-year history of manufacturing and product excellence that will serve our customers well as we assume responsibility for nacelle production,” Gulfstream President Mark Burns said. “The manufacturing of this component is firmly in our wheelhouse, especially since we also manufacture the wings and empennages for these aircraft.”
Family owned Nordam filed for bankruptcy protection after a protracted contract dispute with Pratt & Whitney Canada over the PW800 nacelle system used in G500s and G600s. The company said the bankruptcy was due to this dispute only and other programs were not affected.
Download the full fall 2018 issue of Aircraft Bluebook Marketline to read more.
 Aircraft Bluebook Marketline | Comments Off |
 CHARTS — SEPT. 13, 2011
 Tuesday, September 13, 2011 at 11:18AM
 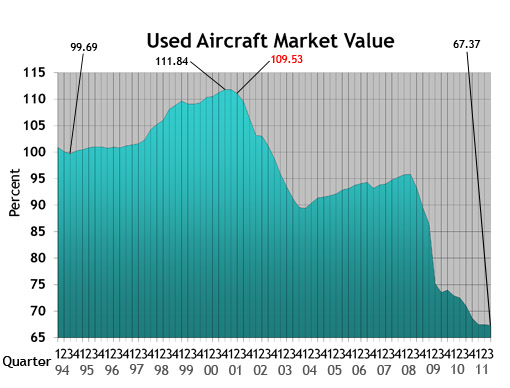 Used Aircraft Market: This chart displays each model's quarterly value in relationship to its average equipped price at the inception of the aircraft. The study begins in the spring quarter of 1994 and includes the Jet, Turboprop, Multi, Piston and Helicopter. For all charts, the red number indicates the first reporting date after 9-11.
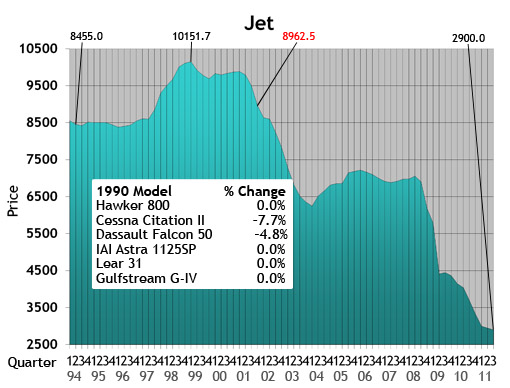 Jet: The jet chart depicts the average price (in thousands) of the six 1990s jets listed in the box.
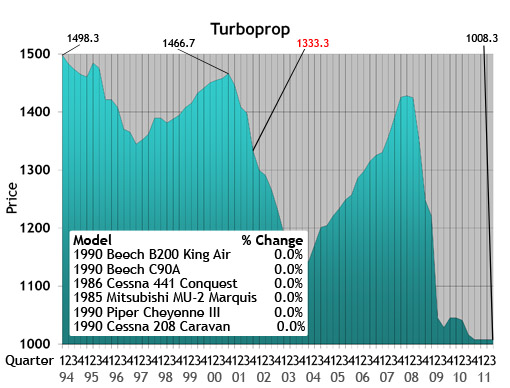 Turboprop: The turboprop chart depicts the average price (in thousands) of a 1985, 1986 and four 1990 turboprops listed in the box.
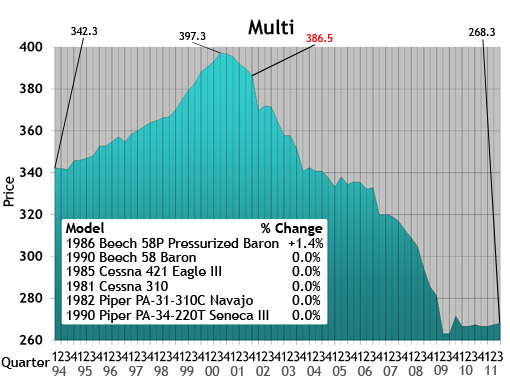 Multi: The multi chart depicts the average price (in thousands) of the six multi models listed in the box. Each model’s year will precede the name of the aircraft.
 Piston: The piston chart depicts the average price (in thousands) of the 10 pistons listed in the box. Each model’s year will precede the name of the aircraft.
 Helicopter: The helicopter chart depicts the average price (in thousands) of the six helicopters listed in the box. Each model’s year will precede the name of the aircraft.
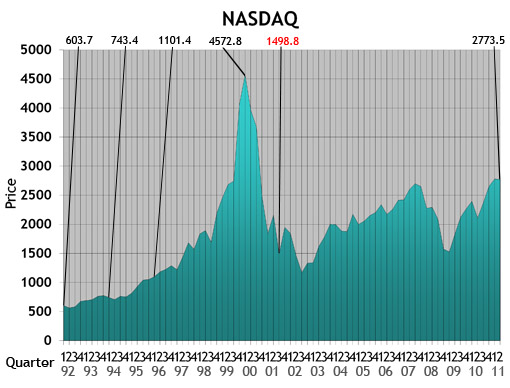 NASDAQ: This ratio scale chart depicts the change for the NASDAQ daily average from quarter to quarter beginning at the end of the first quarter of 1992. Each data point represents the closing daily average on the last trading day of each quarter. This study originates in the first quarter of 1971.
 Aircraft on Registry: The Aircraft on Registry chart depicts the number of aircraft reported in Aircraft Bluebook that are listed on FAA records and considered to be in the U.S. inventory.
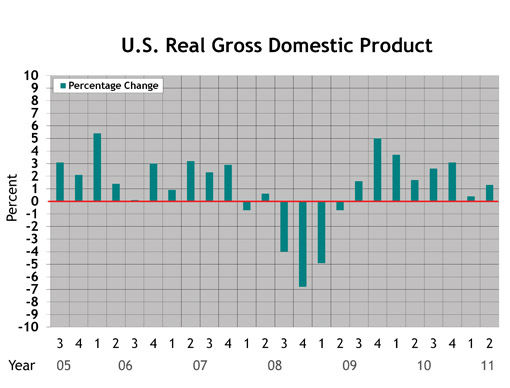 U.S. Real Gross Domestic Product (criteria updated Aug. 27, 2010): This graph represents real gross domestic product measured by the U.S. Bureau of Economic Analysis. Each data point represents the BEA's final figure or latest estimate of the quarter-to-quarter seasonally adjusted annual rates of change in real GDP "based on chained 2005 dollars." The study begins with the second quarter in 2005.
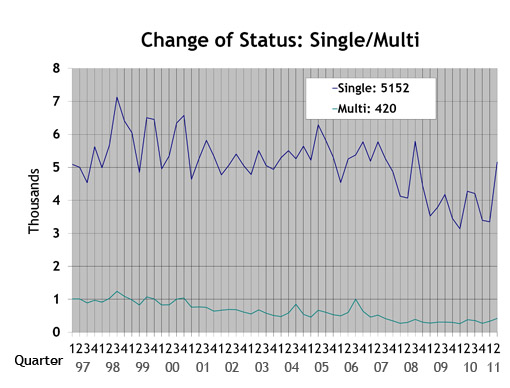 Single/Multi: The blue line in the Single/Multi chart depicts change-of-ownership data for singles. The black line represents multis.
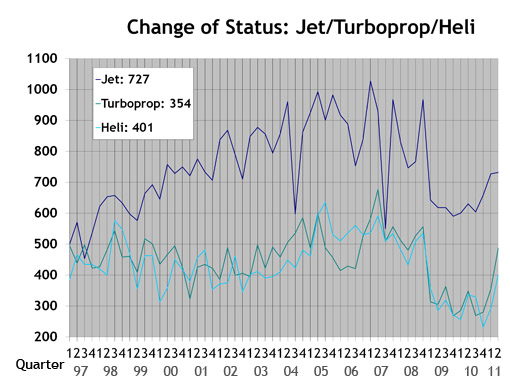 Jet/Turboprop/Heli: The black line in the Jet/Turboprop/Heli chart represents change-of-ownership information for jets. The blue line depicts turboprops, and the gray line represents helicopters.
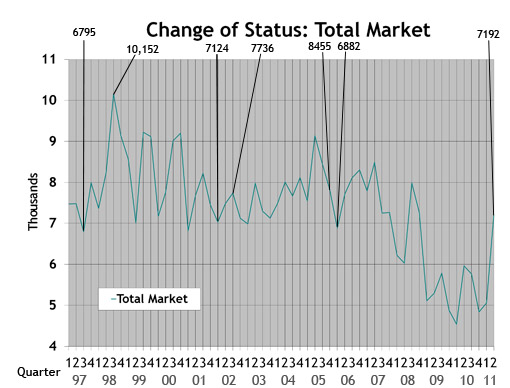 Total Market: Depicts change-of-ownership data for all aircraft included in the Aircraft Bluebook. The numbers are from the FAA Registry. Gliders, homebuilts, airliners and other aircraft not found in the Bluebook are not included in this study.


